애플리케이션 메트릭
이 섹션에서는 워크로드에서 노출되는 메트릭에 대한 인사이트를 얻는 방법을 살펴보겠습니다. 이러한 메트릭의 예시는 다음과 같습니다:
- Java 힙 메트릭이나 데이터베이스 연결 풀 상태와 같은 시스템 메트릭
- 비즈니스 KPI와 관련된 애플리케이션 메트릭
AWS Distro for OpenTelemetry를 사용하여 애플리케이션 메트릭을 수집하고 Grafana를 사용하여 메트릭을 시각화하는 방법을 살펴보겠습니다.
이 워크샵의 각 컴포넌트는 특정 프로그래밍 언어나 프레임워크와 관련된 라이브러리를 사용하여 Prometheus 메트릭을 제공하도록 계측되었습니다. 다음과 같이 orders 서비스에서 이러한 메트릭의 예시를 확인할 수 있습니다:
[...]
# HELP jdbc_connections_idle Number of established but idle connections.
# TYPE jdbc_connections_idle gauge
jdbc_connections_idle{name="reader",} 10.0jdbc_connections_idle{name="writer",} 10.0[...]
# HELP watch_orders_total The number of orders placed
# TYPE watch_orders_total counter
watch_orders_total{productId="510a0d7e-8e83-4193-b483-e27e09ddc34d",} 2.0watch_orders_total{productId="808a2de1-1aaa-4c25-a9b9-6612e8f29a38",} 1.0watch_orders_total{productId="*",} 3.0watch_orders_total{productId="6d62d909-f957-430e-8689-b5129c0bb75e",} 1.0이 명령의 출력은 장황하므로 위의 예시는 다음을 표시하도록 축약되었습니다:
- 시스템 메트릭 - 유휴 상태인 JDBC 연결 수
- 애플리케이션 메트릭 - 소매점을 통해 주문된 총 주문 수
다른 컴포넌트에도 유사한 요청을 실행할 수 있습니다. 예를 들어 checkout 서비스:
[...]
# HELP nodejs_heap_size_total_bytes Process heap size from Node.js in bytes.
# TYPE nodejs_heap_size_total_bytes gauge
nodejs_heap_size_total_bytes 48668672
[...]
이 실습에서는 ADOT를 활용하여 모든 컴포넌트의 메트릭을 수집하고 대시보드를 탐색하여 주문된 주문 수를 확인하겠습니다. 애플리케이션 Pod에서 메트릭을 스크랩하는 데 사용되는 OpenTelemetry 설정을 살펴보겠습니다. 특히 이 섹션을 확인하세요:
job_name: 'kubernetes-pods'
honor_labels: true
kubernetes_sd_configs:
- role: pod
relabel_configs:
- source_labels: [__meta_kubernetes_pod_annotation_prometheus_io_scrape]
action: keep
regex: true
- source_labels: [__meta_kubernetes_pod_annotation_prometheus_io_scrape_slow]
action: drop
regex: true
- source_labels: [__meta_kubernetes_pod_annotation_prometheus_io_scheme]
action: replace
regex: (https?)
target_label: __scheme__
- source_labels: [__meta_kubernetes_pod_annotation_prometheus_io_path]
action: replace
target_label: __metrics_path__
regex: (.+)
- action: labelmap
regex: __meta_kubernetes_pod_annotation_prometheus_io_param_(.+)
replacement: __param_$1
- action: labelmap
regex: __meta_kubernetes_pod_label_(.+)
- source_labels: [__meta_kubernetes_namespace]
action: replace
target_label: namespace
- source_labels: [__meta_kubernetes_pod_name]
action: replace
target_label: pod
- source_labels: [__meta_kubernetes_pod_phase]
regex: Pending|Succeeded|Failed|Completed
action: drop
이 설정은 Prometheus Kubernetes service discovery 메커니즘을 활용하여 특정 어노테이션이 있는 모든 Pod를 자동으로 검색합니다. 이 특정 설정은 prometheus.io/scrape 어노테이션이 있는 모든 Pod를 검색하며, 스크랩하는 메트릭에 네임스페이스 및 Pod 이름과 같은 Kubernetes 메타데이터를 추가합니다.
order 컴포넌트 Pod의 어노테이션을 확인할 수 있습니다:
prometheus.io/path: /actuator/prometheus
prometheus.io/port: "8080"
prometheus.io/scrape: "true"
클러스터 메트릭에 관한 섹션에서 확인한 것처럼, 이러한 Pod 메트릭도 동일한 OpenTelemetry exporter를 사용하여 AMP로 전송됩니다.
다음으로 아래 스크립트를 사용하여 로드 생성기를 실행하면 스토어를 통해 주문이 이루어지고 애플리케이션 메트릭이 생성됩니다:
이전 섹션에서 했던 것처럼 Grafana를 엽니다:

대시보드 페이지로 이동하여 Order Service Metrics 대시보드를 클릭하여 대시보드 내의 패널을 검토합니다:
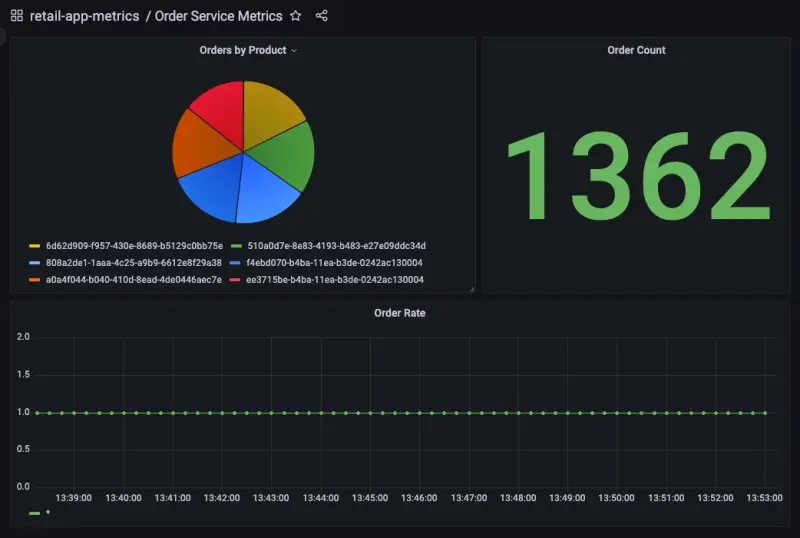
"Orders by Product" 패널의 제목 위로 마우스를 가져가 "Edit" 버튼을 클릭하면 AMP를 쿼리하도록 대시보드가 어떻게 구성되었는지 확인할 수 있습니다:
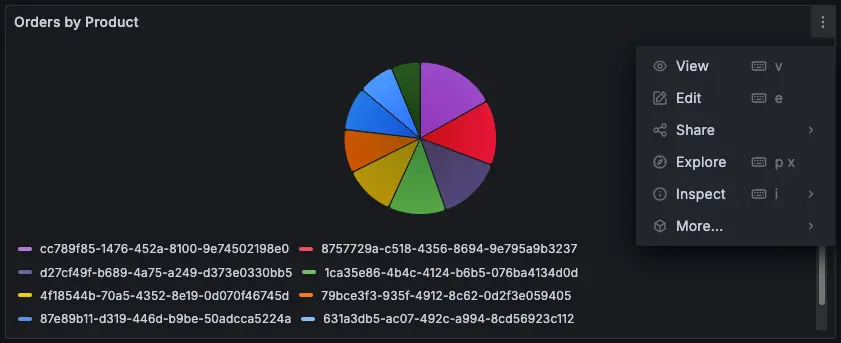
이 패널을 생성하는 데 사용된 PromQL 쿼리가 페이지 하단에 표시됩니다:

이 경우 다음 쿼리를 사용하고 있습니다:
sum by(productId) (watch_orders_total{productId!="*"})
이는 다음을 수행합니다:
watch_orders_total메트릭 쿼리productId값이*인 메트릭 무시- 이러한 메트릭을 합산하고
productId별로 그룹화
다른 패널도 유사하게 탐색하여 어떻게 생성되었는지 이해할 수 있습니다.
메트릭 관찰이 만족스러우면 아래 명령을 사용하여 로드 생성기를 중지할 수 있습니다.