클러스터 메트릭
ADOT Collector를 사용하여 EKS 클러스터에 대한 CloudWatch Container Insights 메트릭을 활성화하는 방법을 살펴보겠습니다. 먼저 클러스터의 노드, Pod, 컨테이너와 같은 다양한 측면과 관련된 메트릭을 수집하는 collector를 클러스터에 생성해야 합니다.
아래에서 전체 collector 매니페스트를 확인한 다음, 이를 세분화하여 설명하겠습니다.
전�체 collector 매니페스트 확장
apiVersion: opentelemetry.io/v1beta1
kind: OpenTelemetryCollector
metadata:
  name: adot-container-ci
  namespace: other
spec:
  image: public.ecr.aws/aws-observability/aws-otel-collector:v0.40.0
  mode: daemonset
  serviceAccount: adot-collector-ci
  config:
    receivers:
      awscontainerinsightreceiver:
        add_full_pod_name_metric_label: true

    processors:
      batch/metrics:
        timeout: 60s

    exporters:
      awsemf/performance:
        namespace: ContainerInsights
        log_group_name: "/aws/containerinsights/${EKS_CLUSTER_NAME}/performance"
        log_stream_name: "{NodeName}"
        resource_to_telemetry_conversion:
          enabled: true
        dimension_rollup_option: NoDimensionRollup
        parse_json_encoded_attr_values: [Sources, kubernetes]
        metric_declarations:
          # node metrics
          - dimensions: [[NodeName, InstanceId, ClusterName]]
            metric_name_selectors:
              - node_cpu_utilization
              - node_memory_utilization
              - node_network_total_bytes
              - node_cpu_reserved_capacity
              - node_memory_reserved_capacity
              - node_number_of_running_pods
              - node_number_of_running_containers
          - dimensions: [[ClusterName]]
            metric_name_selectors:
              - node_cpu_utilization
              - node_memory_utilization
              - node_network_total_bytes
              - node_cpu_reserved_capacity
              - node_memory_reserved_capacity
              - node_number_of_running_pods
              - node_number_of_running_containers
              - node_cpu_usage_total
              - node_cpu_limit
              - node_memory_working_set
              - node_memory_limit

          # pod metrics
          - dimensions:
              [
                [FullPodName, PodName, Namespace, ClusterName],
                [PodName, Namespace, ClusterName],
                [Service, Namespace, ClusterName],
                [Namespace, ClusterName],
                [ClusterName],
              ]
            metric_name_selectors:
              - pod_cpu_utilization
              - pod_memory_utilization
              - pod_network_rx_bytes
              - pod_network_tx_bytes
              - pod_cpu_utilization_over_pod_limit
              - pod_memory_utilization_over_pod_limit
          - dimensions:
              [
                [FullPodName, PodName, Namespace, ClusterName],
                [PodName, Namespace, ClusterName],
                [ClusterName],
              ]
            metric_name_selectors:
              - pod_cpu_reserved_capacity
              - pod_memory_reserved_capacity
          - dimensions:
              [
                [FullPodName, PodName, Namespace, ClusterName],
                [PodName, Namespace, ClusterName],
              ]
            metric_name_selectors:
              - pod_number_of_container_restarts

          # container metrics
          - dimensions:
              [
                [FullPodName, PodName, Namespace, ClusterName, ContainerName],
                [PodName, Namespace, ClusterName, ContainerName],
                [Namespace, ClusterName, ContainerName],
                [ClusterName, ContainerName],
              ]
            metric_name_selectors:
              - container_cpu_utilization
              - container_memory_utilization
              - number_of_container_restarts

          # cluster metrics
          - dimensions: [[ClusterName]]
            metric_name_selectors:
              - cluster_node_count
              - cluster_failed_node_count

          # service metrics
          - dimensions: [[Service, Namespace, ClusterName], [ClusterName]]
            metric_name_selectors:
              - service_number_of_running_pods

          # node fs metrics
          - dimensions: [[NodeName, InstanceId, ClusterName], [ClusterName]]
            metric_name_selectors:
              - node_filesystem_utilization

          # namespace metrics
          - dimensions: [[Namespace, ClusterName], [ClusterName]]
            metric_name_selectors:
              - namespace_number_of_running_pods

    extensions:
      health_check: {}

    service:
      pipelines:
        metrics:
          receivers: [awscontainerinsightreceiver]
          processors: [batch/metrics]
          exporters: [awsemf/performance]
      extensions: [health_check]

  securityContext:
    runAsUser: 0
    runAsGroup: 0

  env:
    - name: K8S_NODE_NAME
      valueFrom:
        fieldRef:
          fieldPath: spec.nodeName
    - name: HOST_IP
      valueFrom:
        fieldRef:
          fieldPath: status.hostIP
    - name: HOST_NAME
      valueFrom:
        fieldRef:
          fieldPath: spec.nodeName
    - name: K8S_NAMESPACE
      valueFrom:
        fieldRef:
          fieldPath: metadata.namespace
    - name: "K8S_POD_NAME"
      valueFrom:
        fieldRef:
          fieldPath: "metadata.name"
  volumeMounts:
    - name: rootfs
      mountPath: /rootfs
      readOnly: true
    - name: dockersock
      mountPath: /var/run/docker.sock
      readOnly: true
    - name: containerdsock
      mountPath: /run/containerd/containerd.sock
    - name: varlibdocker
      mountPath: /var/lib/docker
      readOnly: true
    - name: sys
      mountPath: /sys
      readOnly: true
    - name: devdisk
      mountPath: /dev/disk
      readOnly: true
  volumes:
    - name: rootfs
      hostPath:
        path: /
    - name: dockersock
      hostPath:
        path: /var/run/docker.sock
    - name: varlibdocker
      hostPath:
        path: /var/lib/docker
    - name: containerdsock
      hostPath:
        path: /run/containerd/containerd.sock
    - name: sys
      hostPath:
        path: /sys
    - name: devdisk
      hostPath:
        path: /dev/disk/
이를 여러 부분으로 나누어 더 잘 이해할 수 있도록 하겠습니다.
  image: public.ecr.aws/aws-observability/aws-otel-collector:v0.40.0
  mode: daemonset
OpenTelemetry collector는 수집하는 텔레메트리에 따라 여러 가지 모드로 실행될 수 있습니다. 이 경우 DaemonSet으로 실행하여 EKS 클러스터의 각 노드에서 Pod가 실행되도록 합니다. 이를 통해 노드와 컨테이너 런타임에서 텔레메트리를 수집할 수 있습니다.
다음으로 collector 구성 자체를 세분화하여 살펴보겠습니다.
  config:
    receivers:
      awscontainerinsightreceiver:
        add_full_pod_name_metric_label: true
먼저 AWS Container Insights Receiver를 구성하여 노드에서 메트릭을 수집합니다.
    processors:
      batch/metrics:
        timeout: 60s
다음으로 batch processor를 사용하여 최대 60초 동안 버퍼링된 메트릭을 플러시하여 CloudWatch에 대한 API 호출 수를 줄입니다.
    exporters:
      awsemf/performance:
        namespace: ContainerInsights
        log_group_name: "/aws/containerinsights/${EKS_CLUSTER_NAME}/performance"
이제 AWS CloudWatch EMF Exporter for OpenTelemetry Collector를 사용하여 OpenTelemetry 메트릭을 AWS CloudWatch Embedded Metric Format (EMF)로 변환한 다음 PutLogEvents API를 사용하여 CloudWatch Logs로 직접 전송합니다. 로그 항목은 표시된 CloudWatch Logs 로그 그룹으로 전송되며 메트릭은 ContainerInsights 네임스페이스에 나타납니다. 이 섹션의 나머지 부분은 전체를 표시하기에는 너무 길지만 위의 전체 매니페스트를 참조하세요.
      pipelines:
        metrics:
          receivers: [awscontainerinsightreceiver]
          processors: [batch/metrics]
          exporters: [awsemf/performance]
마지막으로 OpenTelemetry 파이프라인을 사용하여 receiver, processor, exporter를 결합해야 합니다.
관리형 IAM 정책인 CloudWatchAgentServerPolicy를 사용하여 collector가 IAM Roles for Service Accounts를 통해 CloudWatch로 메트릭을 전송하는 데 필요한 IAM 권한을 제공합니다:
{"AttachedPolicies": [
{"PolicyName": "CloudWatchAgentServerPolicy",
"PolicyArn": "arn:aws:iam::aws:policy/CloudWatchAgentServerPolicy"
}
]
}
이 IAM role은 collector의 ServiceAccount에 추가됩니다:
apiVersion: v1
kind: ServiceAccount
metadata:
  name: adot-collector-ci
  annotations:
    eks.amazonaws.com/role-arn: ${ADOT_IAM_ROLE_CI}
위에서 살펴본 리소스를 생성합니다:
DaemonSet에 의해 생성된 Pod를 검사하여 collector가 실행 중인지 확인할 수 있습니다:
NAME READY STATUS RESTARTS AGE
adot-container-ci-collector-5lp5g 1/1 Running 0 15s
adot-container-ci-collector-ctvgs 1/1 Running 0 15s
adot-container-ci-collector-w4vqs 1/1 Running 0 15s
이는 collector가 실행 중이며 클러스터에서 메트릭을 수집하고 있음을 보여줍니다. 메트릭을 보려면 먼저 CloudWatch 콘솔을 열고 Container Insights로 이동합니다:
다음 사항에 유의하세요:
- CloudWatch에 데이터가 표시되기 시작하는 데 몇 분이 걸릴 수 있습니다
- 향상된 관측 가능성을 갖춘 CloudWatch 에이전트에서 제공하는 일부 메트릭이 누락되는 것은 예상된 동작입니다
 CloudWatch 콘솔 열기
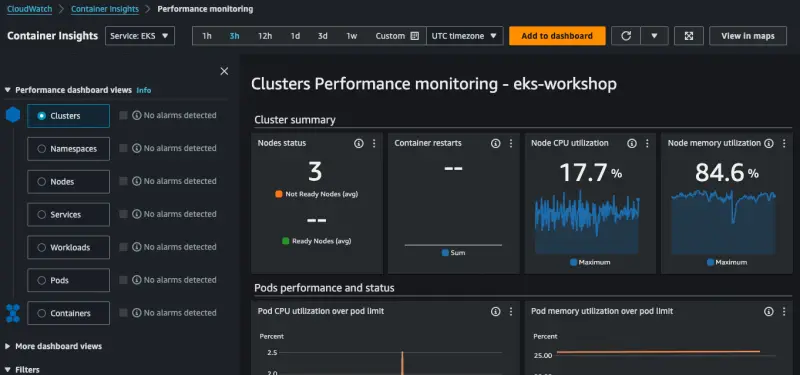
시간을 내어 콘솔을 탐색하면서 클러스터, 네임스페이스 또는 Pod별로 메트릭이 표시되는 다양한 방법을 확인할 수 있습니다.