애플리케이션 메트릭
이번 섹션에서는 워크로드에서 노출되는 메트릭에 대한 인사이트를 얻고 Amazon CloudWatch Insights Prometheus를 사용하여 해당 메트릭을 시각화하는 방법을 살펴보겠습니다. 이러한 메트릭의 예시는 다음과 같습니다:
- Java 힙 메트릭 또는 데이터베이스 연결 풀 상태와 같은 시스템 메트릭
- 비즈니스 KPI와 관련된 애플리케이션 메트릭
AWS Distro for OpenTelemetry를 사용하여 애플리케이션 메트릭을 수집하고 Amazon CloudWatch를 사용하여 메트릭을 시각화하는 방법을 살펴보겠습니다.
이 워크샵의 각 컴포넌트는 특정 프로그래밍 언어 또는 프레임워크와 관련된 라이브러리를 사용하여 Prometheus 메트릭을 제공하도록 계측되었습니다. orders 서비스에서 이러한 메트릭의 예시를 다음과 같이 확인할 수 있습니다:
[...]
# HELP jdbc_connections_idle Number of established but idle connections.
# TYPE jdbc_connections_idle gauge
jdbc_connections_idle{name="reader",} 10.0jdbc_connections_idle{name="writer",} 10.0[...]
# HELP watch_orders_total The number of orders placed
# TYPE watch_orders_total counter
watch_orders_total{productId="510a0d7e-8e83-4193-b483-e27e09ddc34d",} 2.0watch_orders_total{productId="808a2de1-1aaa-4c25-a9b9-6612e8f29a38",} 1.0watch_orders_total{productId="*",} 3.0watch_orders_total{productId="6d62d909-f957-430e-8689-b5129c0bb75e",} 1.0이 명령의 출력은 상세합니다. 이 실습을 위해 메트릭 - watch_orders_total에 집중하겠습니다:
watch_orders_total- 애플리케이션 메트릭 - 소매점을 통해 주문된 수
다른 컴포넌트에 대해서도 유사한 요청을 실행할 수 있습니다. 예를 들어 checkout 서비스:
[...]
# HELP nodejs_heap_size_total_bytes Process heap size from Node.js in bytes.
# TYPE nodejs_heap_size_total_bytes gauge
nodejs_heap_size_total_bytes 48668672
[...]
앞서 배포한 컬렉터가 DaemonSet이었음을 기억하실 것입니다. 즉, 모든 노드에서 실행됩니다. 이는 클러스터의 Pod에서 메트릭을 스크래핑할 때 바람직하지 않습니다. 중복된 메트릭이 발생하기 때문입니다. 이제 단일 레플리카로 Deployment로 실행되는 두 번째 컬렉터를 배포하겠습니다.
전체 컬렉터 매니페스트 확장
apiVersion: opentelemetry.io/v1beta1
kind: OpenTelemetryCollector
metadata:
  name: adot-container-ci-deploy
  namespace: other
spec:
  image: public.ecr.aws/aws-observability/aws-otel-collector:v0.40.0
  mode: deployment
  serviceAccount: adot-collector-ci
  config:
    receivers:
      prometheus:
        config:
          global:
            scrape_interval: 60s
            scrape_timeout: 15s
            external_labels:
              cluster: ${EKS_CLUSTER_NAME}
              account_id: ${AWS_ACCOUNT_ID}
              region: ${AWS_REGION}
          scrape_configs:
            - job_name: "kubernetes-pods"
              honor_labels: true

              kubernetes_sd_configs:
                - role: pod
              relabel_configs:
                - source_labels:
                    [__meta_kubernetes_pod_annotation_prometheus_io_scrape]
                  action: keep
                  regex: true
                - source_labels:
                    [__meta_kubernetes_pod_annotation_prometheus_io_scrape_slow]
                  action: drop
                  regex: true
                - source_labels:
                    [__meta_kubernetes_pod_annotation_prometheus_io_scheme]
                  action: replace
                  regex: (https?)
                  target_label: __scheme__
                - source_labels:
                    [__meta_kubernetes_pod_annotation_prometheus_io_path]
                  action: replace
                  target_label: __metrics_path__
                  regex: (.+)
                - action: labelmap
                  regex: __meta_kubernetes_pod_annotation_prometheus_io_param_(.+)
                  replacement: __param_$$1
                - action: labelmap
                  regex: __meta_kubernetes_pod_label_(.+)
                - source_labels: [__meta_kubernetes_namespace]
                  action: replace
                  target_label: namespace
                - source_labels: [__meta_kubernetes_pod_name]
                  action: replace
                  target_label: pod
                - source_labels: [__meta_kubernetes_pod_phase]
                  regex: Pending|Succeeded|Failed|Completed
                  action: drop

    processors:
      batch/metrics:
        timeout: 60s

    exporters:
      awsemf/prometheus:
        namespace: ContainerInsights/Prometheus
        log_group_name: "/aws/containerinsights/${EKS_CLUSTER_NAME}/prometheus"
        log_stream_name: "${K8S_POD_NAME}"
        region: ${AWS_REGION}
        resource_to_telemetry_conversion:
          enabled: true
        dimension_rollup_option: NoDimensionRollup
        metric_declarations:
          - dimensions: [[pod, productId]]
            metric_name_selectors:
              - "^watch_orders_total$"

    extensions:
      health_check: {}

    service:
      pipelines:
        metrics:
          receivers: [prometheus]
          processors: [batch/metrics]
          exporters: [awsemf/prometheus]
      extensions: [health_check]

  env:
    - name: K8S_NODE_NAME
      valueFrom:
        fieldRef:
          fieldPath: spec.nodeName
    - name: HOST_IP
      valueFrom:
        fieldRef:
          fieldPath: status.hostIP
    - name: HOST_NAME
      valueFrom:
        fieldRef:
          fieldPath: spec.nodeName
    - name: K8S_NAMESPACE
      valueFrom:
        fieldRef:
          fieldPath: metadata.namespace
    - name: "K8S_POD_NAME"
      valueFrom:
        fieldRef:
          fieldPath: "metadata.name"
이를 더 잘 이해하기 위해 여러 부분으로 나누어 검토할 수 있습니다.
  image: public.ecr.aws/aws-observability/aws-otel-collector:v0.40.0
  mode: deployment
언급했듯이 이번에는 Deployment를 사용합니다.
다음으로 컬렉터 구성 자체를 분석하기 시작할 수 있습니다.
  config:
    receivers:
      prometheus:
        config:
          global:
            scrape_interval: 60s
            scrape_timeout: 15s
            external_labels:
              cluster: ${EKS_CLUSTER_NAME}
              account_id: ${AWS_ACCOUNT_ID}
              region: ${AWS_REGION}
          scrape_configs:
            - job_name: "kubernetes-pods"
              honor_labels: true

              kubernetes_sd_configs:
                - role: pod
              relabel_configs:
                - source_labels:
                    [__meta_kubernetes_pod_annotation_prometheus_io_scrape]
                  action: keep
                  regex: true
                - source_labels:
                    [__meta_kubernetes_pod_annotation_prometheus_io_scrape_slow]
                  action: drop
                  regex: true
                - source_labels:
                    [__meta_kubernetes_pod_annotation_prometheus_io_scheme]
                  action: replace
                  regex: (https?)
                  target_label: __scheme__
                - source_labels:
                    [__meta_kubernetes_pod_annotation_prometheus_io_path]
                  action: replace
                  target_label: __metrics_path__
                  regex: (.+)
                - action: labelmap
                  regex: __meta_kubernetes_pod_annotation_prometheus_io_param_(.+)
                  replacement: __param_$$1
                - action: labelmap
                  regex: __meta_kubernetes_pod_label_(.+)
                - source_labels: [__meta_kubernetes_namespace]
                  action: replace
                  target_label: namespace
                - source_labels: [__meta_kubernetes_pod_name]
                  action: replace
                  target_label: pod
                - source_labels: [__meta_kubernetes_pod_phase]
                  regex: Pending|Succeeded|Failed|Completed
                  action: drop
AWS Container Insights Receiver 대신 Prometheus receiver를 사용하여 EKS 클러스터의 모든 Pod를 스크래핑합니다.
    processors:
      batch/metrics:
        timeout: 60s
이전 컬렉터와 동일한 배치 프로세서를 사용합니다.
      awsemf/prometheus:
        namespace: ContainerInsights/Prometheus
        log_group_name: "/aws/containerinsights/${EKS_CLUSTER_NAME}/prometheus"
        log_stream_name: "${K8S_POD_NAME}"
        region: ${AWS_REGION}
        resource_to_telemetry_conversion:
          enabled: true
        dimension_rollup_option: NoDimensionRollup
        metric_declarations:
          - dimensions: [[pod, productId]]
            metric_name_selectors:
              - "^watch_orders_total$"
AWS CloudWatch EMF Exporter for OpenTelemetry Collector를 사용하지만 이번에는 네임스페이스 ContainerInsights/Prometheus를 사용합니다.
      pipelines:
        metrics:
          receivers: [prometheus]
          processors: [batch/metrics]
          exporters: [awsemf/prometheus]
그리고 이전과 마찬가지로 이들을 파이프라인으로 결합합니다.
위에서 탐색한 리소스를 생성합니다:
DaemonSet에 의해 생성된 Pod를 검사하여 컬렉터가 실행 중인지 확인할 수 있습니다:
NAME READY STATUS RESTARTS AGE
adot-container-ci-deploy-collector-5lp5g 1/1 Running 0 15s
이제 설정이 완료되었으므로 아래 스크립트를 사용하여 로드 생성기를 실행하여 스토어를 통해 주문하고 애플리케이션 메트릭을 생성합니다:
CloudWatch 콘솔을 열고 대시보드 섹션으로 이동합니다:
 CloudWatch 콘솔 열기
대시보드 Order-Service-Metrics를 선택하여 대시보드 내의 패널을 검토합니다:

"Orders by Product" 패널의 제목 위에 마우스를 올리고 "Edit" 버튼을 클릭하여 대시보드가 CloudWatch를 쿼리하도록 구성된 방법을 확인할 수 있습니다:
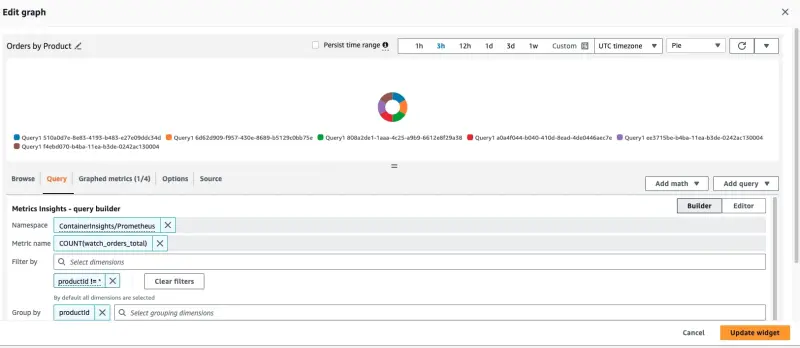
이 패널을 생성하는 데 사용된 쿼리가 페이지 하단에 표시됩니다:
SELECT COUNT(watch_orders_total) FROM "ContainerInsights/Prometheus" WHERE productId != '*' GROUP BY productId
이는 다음을 수행합니다:
- 메트릭
watch_orders_total쿼리 productId값이*인 메트릭 무시- 이러한 메트릭을 합산하고
productId별로 그룹화
메트릭 관찰에 만족하면 아래 명령을 사용하여 로드 생성기를 중지할 수 있습니다.